


In general, being an entrepreneur is tough, but many minority entrepreneurs face an even steeper climb on the path to success for a myriad of reasons. They have limited access to startup funding, lack networks and mentorship programs, and face discrimination and systemic biases.
Given these hurdles – and the fact that 20% of all new businesses fail within the first year – it’s critical that minority entrepreneurs set up shop in as favorable a location as possible.
Lendio analyzed eight metrics to determine the best states for minority entrepreneurs, considering factors such as access to small business loans catered to underserved communities, business ownership rates compared to the state’s minority population, job growth at minority-owned businesses, and overall income equality.
Key findings
- Vermont No. 1 Best State for Minority Entrepreneurs: Driven by its high percentage of business loan approvals per 10,000 residents, an influx of minority-owned startups, low unemployment rate, and lower overall income disparities.
- Hawaii has the highest minority business ownership rates in the country. 51% of businesses are owned by minorities in Hawaii while minorities make up 78% of the state’s population. Hawaii dips in overall rankings due to lower access to capital, average unemployment rates, and lower startup growth.
- Washington D.C. has the highest Black business ownership rates in the country. While D.C. also has one of the highest approval rates for Community Advantage loans and microloans, it falls in the overall rankings due to Blacks and African Americans only owning 15% of small businesses despite making up 42% of the population along with high unemployment rates and income disparities.
Top 20 states
In No. 1 Vermont, the number of Community Advantage loans (.015) and SBA microloans (.34 ) approved per 10,000 residents is high (.34). While West Virginia has the least disparity between its minority population and percentage of minority-owned businesses, Vermont comes in third at a 6.7% difference. Vermont also saw a 560% increase in the number of startups under two years old run by minority entrepreneurs from 2000 to 2001 and a 93% increase in job growth at Minority Business Enterprises. With an average unemployment rate of just 2.23% and a Gini index of .45, Vermont provides a fertile economic environment for small business owners.
Wyoming, South Dakota, North Dakota, and New Hampshire round out the top five best places for minority entrepreneurs. Wyoming (161.7) and South Dakota (90.98) both receive a high number of Community Reinvestment Act loans per 10,000 residents. North Dakota saw a large increase (86%) in job growth at Minority Business Enterprises from 2021-2022. New Hampshire has the second lowest minority unemployment rate at 1.5%
When the list is filtered to Black or African American populations specifically, Alaska, New Mexico and Hawaii move into the top 20 with Missouri, Massachusetts, and Ohio dropping out.
| State | Rank (Minorities) |
Rank (Black) |
|---|---|---|
| Vermont | 1 | 2 |
| Wyoming | 2 | 1 |
| South Dakota | 3 | 7 |
| North Dakota | 4 | 4 |
| New Hampshire | 5 | 10 |
| Montana | 6 | 5 |
| Maine | 7 | 13 |
| Utah | 8 | 6 |
| Kansas | 9 | 18 |
| Minnesota | 10 | 11 |
| Maryland | 11 | 17 |
| Idaho | 12 | 3 |
| Oregon | 13 | 12 |
| Colorado | 14 | 8 |
| Missouri | 15 | 22 |
| Nebraska | 16 | 14 |
| Florida | 17 | 16 |
| Ohio | 18 | 25 |
| Wisconsin | 19 | 20 |
| Massachusetts | 20 | 27 |
| Alaska | 31 | 9 |
| New Mexico | 47 | 15 |
| Hawaii | 32 | 19 |
States with the highest percentage of minority-owned businesses.
While the rankings above compare the percentage of businesses owned by minorities to the percentage of the population that is a racial minority, these rankings show the percentage of minority-owned businesses overall.
| State | Minority-Owned Businesses |
|---|---|
| Hawaii | 50.87% |
| District of Columbia | 29.45% |
| California | 26.21% |
| Georgia | 22.39% |
| Maryland | 22.18% |
| New York | 21.39% |
| New Jersey | 20.53% |
| Virginia | 19.75% |
| Texas | 18.06% |
| Delaware | 15.69% |
States with the highest percentage of Black-owned businesses.
While the rankings above compare the percentage of businesses owned by Blacks or African Americans to the percentage of the population that is Black or African American, these rankings show the percentage of Black-owned businesses overall. Visit this post for more Black-owned business statistics.
| State | Black-owned businesses |
|---|---|
| District of Columbia | 15.17% |
| Georgia | 8.00% |
| Maryland | 7.88% |
| Mississippi | 5.68% |
| Louisiana | 4.62% |
| Virginia | 4.42% |
| North Carolina | 4.40% |
| Delaware | 4.38% |
| South Carolina | 4.21% |
| Missouri | 4.15% |
Growth of minority-owned businesses
The number of businesses owned by Black, Hispanic, and Asian Americans has climbed to record highs – reaching about 1.2 million in 2020, up more than 50% compared to 2007.
This is welcome news given research shows that workforce diversity is good for the companies’ bottom line and for the economy at large. More than half of the 2 million new businesses started in the U.S. over the past 10 years were launched by minorities, creating 4.7 million jobs. But America has much more work to do to empower minority entrepreneurs. People of color own only 20% of U.S. businesses despite making up roughly 40% of the population. This contributes to income inequality.
Lending environment
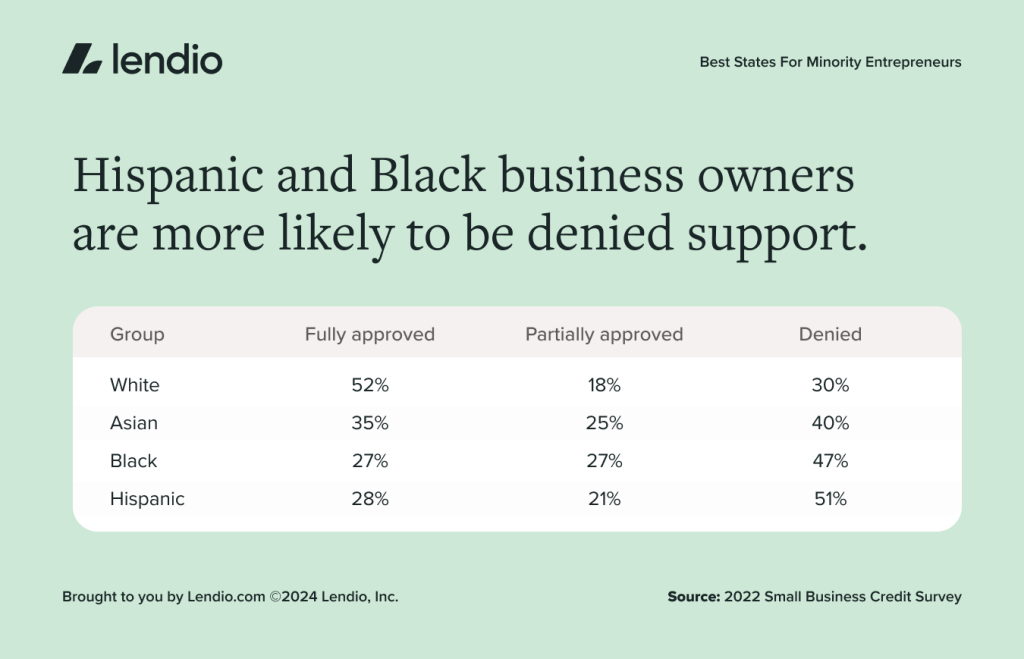
Access to capital is crucial for any small business owner, but it is particularly important for minority entrepreneurs who may struggle to secure startup funding or loans from traditional financial institutions. The lending gap – which can also come in the form of unequal lending terms and underinvestment – hinders minority entrepreneurs’ ability to start, invest in and scale their businesses.
The data speaks for itself: 52% of white entrepreneurs are fully approved for financing, compared with 35% of Asians, 28% of Hispanics and 27% of Black applicants. In fact, 40% of Black business owners don’t even apply for financing because they expect they’ll be rejected, according to the National Minority Supplier Development Council.
Minority entrepreneurs may face challenges in obtaining loans or credit from traditional financial institutions, but there are some policies and programs from the Small Business Administration that aim to bridge the funding gap and support entrepreneurship in underrepresented communities.
The Community Reinvestment Act, for example, requires banks to offer lending and investment services to underserved communities, and regulators are considering substantial reform that would make race and ethnicity an explicit focus. Our analysis of CRA loans originated per 10,000 residents – 120 on average across the states – examines how well banks are currently supporting underserved business owners, though it doesn’t address minority business owners specifically. Montana ranked the best on this metric, with 180 in CRA loans per 10,000 residents, while West Virginia came in last with 66.
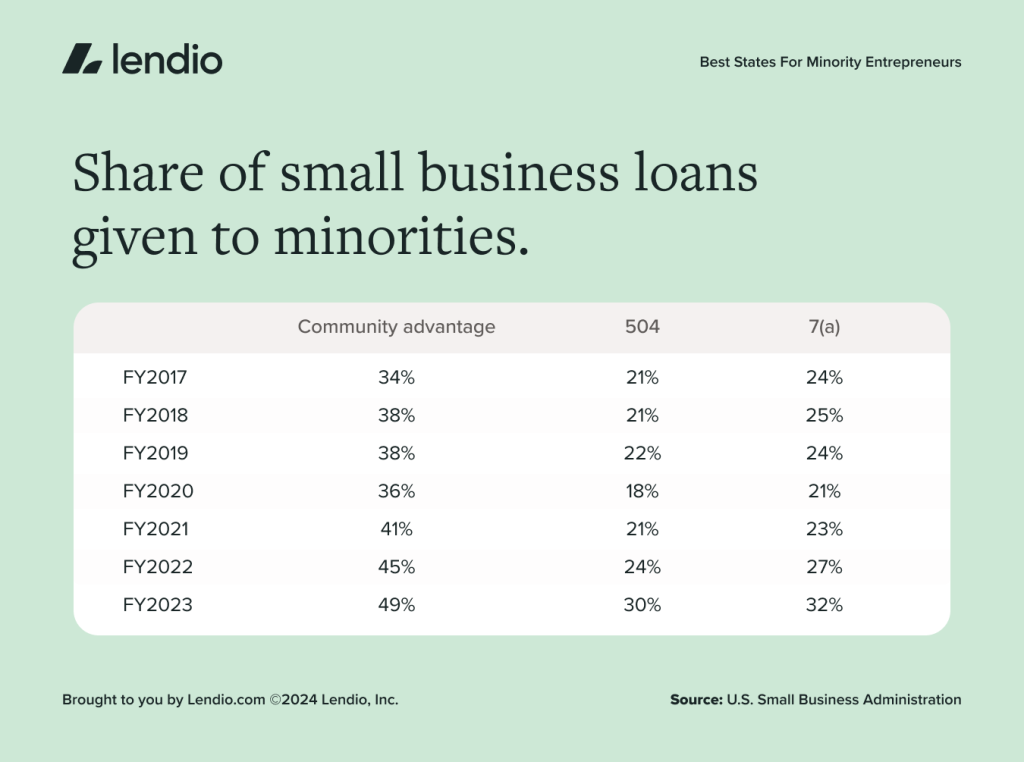
Meanwhile, the 7(a) Community Advantage loans are targeted at small businesses in underserved markets, including opportunity zones and low- and moderate-income areas. Overall, 49% of these loans went to racial and ethnic minorities in 2023, compared with roughly 33% of 7(a) and 504 loans in 2023, which are other common loans for small business owners.
Economic environment
The overall economic environment in a state also offers clues as to the level of opportunity for minority business owners. Income inequality, for example, is measured using the Gini index; a score of 0 would indicate perfect equality, while a score of 1 indicates total inequality. In the U.S., the Gini index was 0.482 in 2022, up slightly from .481 in 2021.
Studies have found unemployment rates and entrepreneurship rates have a dynamic relationship with unemployment spurring entrepreneurship and entrepreneurship in turn lowering unemployment rates. However, studies have also found that unemployment spurring entrepreneurship only holds true in higher-income areas.
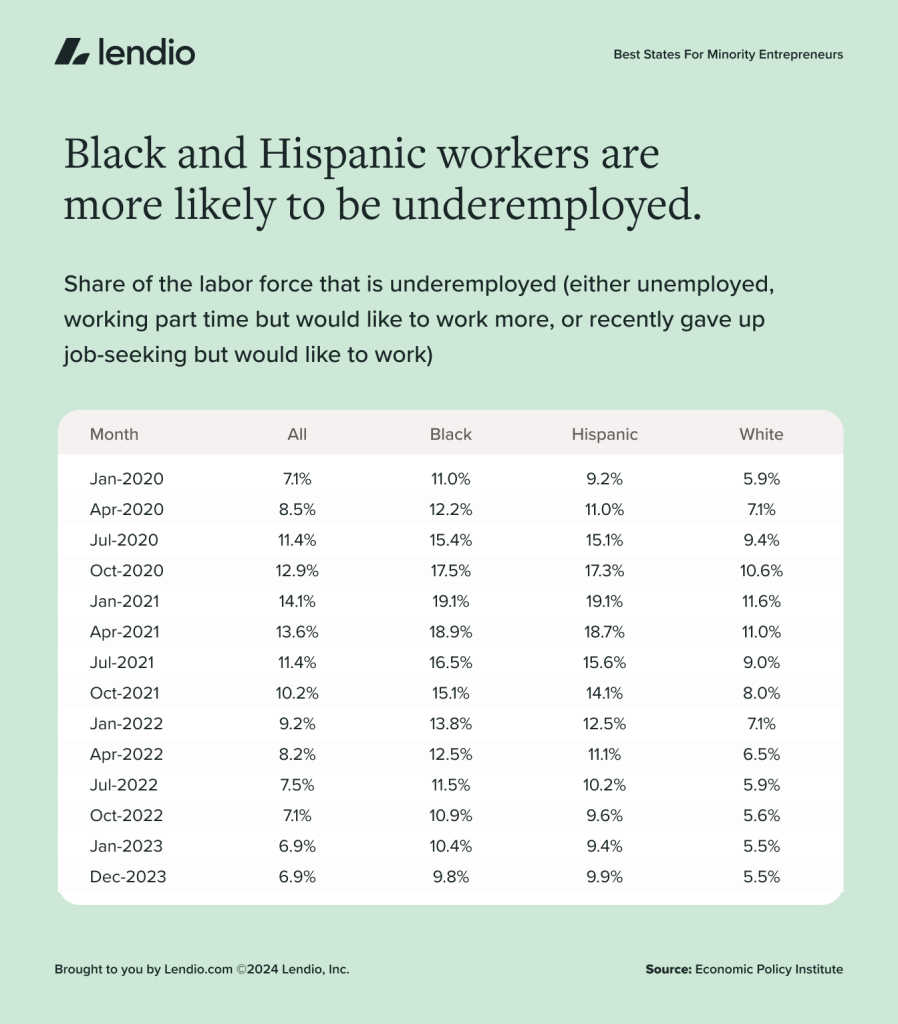
There are also longstanding racial gaps when it comes to underemployment, defined as the share of the labor force that is 1) unemployed, 2) working part-time but would like to work more or 3) recently gave up job-seeking but would prefer to work. According to the Economic Policy Institute, the underemployed rate was 9.8% among Black adults, 9.9% among Hispanics and 5.5% among white people in December 2023.
Conclusion
Not all business owners have equal opportunities to succeed. In particular, minority entrepreneurs face barriers in accessing the capital they need to start and grow their businesses – even in the top-ranked states. With this report, we aim to raise awareness about the need to level the playing field for minority entrepreneurs.
Specifically, we recommend the following within the lending industry:
- Greater use of automation throughout the qualification process: Automation not only expands access to capital for more small businesses by reducing costs for lenders but also reduces discrimination and bias. For example, a paper by the National Bureau of Economic Research found that after traditional banks automated their processes, lending to Black-owned firms increased.
- Alternative underwriting solutions: Many small businesses are cash-only making it difficult to build up the business credit necessary to meet traditional loan qualification requirements. Lendio’s technology mines customer deposit data instead of relying exclusively on credit score to pre-qualify customers for a loan. This approach is supported by a paper from the Bank for International Settlements that found that the alternative data used by two FinTech companies was able to better predict future loan performance than traditional methods, especially in areas with high unemployment.
- We’re pleased to see progress toward more resources for underserved groups, like the recent announcement from Treasury Dept and Vice President Harris in April of over $1.73 billion in grants for Community Development Financial Institutions (CDFIs) across the country.
Methodology
We used the most recent data for these eight metrics below to determine the best states for minority entrepreneurs. We used a Z-score distribution to scale each metric relative to the mean across all 50 states and Washington, D.C., and capped outliers at 2. We multiplied some Z-scores by -1, given a higher score was negatively associated with being above the national average. A state’s overall ranking was calculated using its average Z-score across the eight metrics. In cases where states were missing data due to a low sample size, the remaining metrics were averaged to determine their overall scores. Here’s a closer look at the metrics we used:
Lending environment
- Community Advantage Loans approved (Small Business Administration, 2021-2022), per 10,000 residents (Census Bureau, 2022)
- Microloans approved ((Small Business Administration, 2021-2022), per 10,000 residents (Census Bureau, 2022)
- Community Reinvestment Act loans originated for small business owners with revenues of $1 million or less Federal Reserve, 2021, per 10,000 residents (Census Bureau, 2022).
Business environment
Economic environment
Information provided on this blog is for educational purposes only, and is not intended to be business, legal, tax, or accounting advice. The views and opinions expressed in this blog are those of the authors and do not necessarily reflect the official policy or position of Lendio. While Lendio strives to keep its content up-to-date, it is only accurate as of the date posted. Offers or trends may expire, or may no longer be relevant.
Read the full article here


